
Calculate Average Time in Status by Work Item Type in Google Sheets (JSON Feed)
📝 Context: A project management team uses Jira to run multiple workflows across several projects. They need clearer visibility into how long tasks spend in each status to spot bottlenecks and improve throughput. By combining Time in Status with relevant Jira work item fields (e.g., Work Item Type, Team, Priority), and exposing the report via a dynamic JSON Data Feed into Google Sheets, the team can build an always-current pivot report that shows average time-in-status by work item type (and other segments). This setup helps them monitor progress, compare performance across workflows, and make targeted process changes that improve efficiency. |
|---|
🤔 User Problem:
|
|---|
💡 Solution
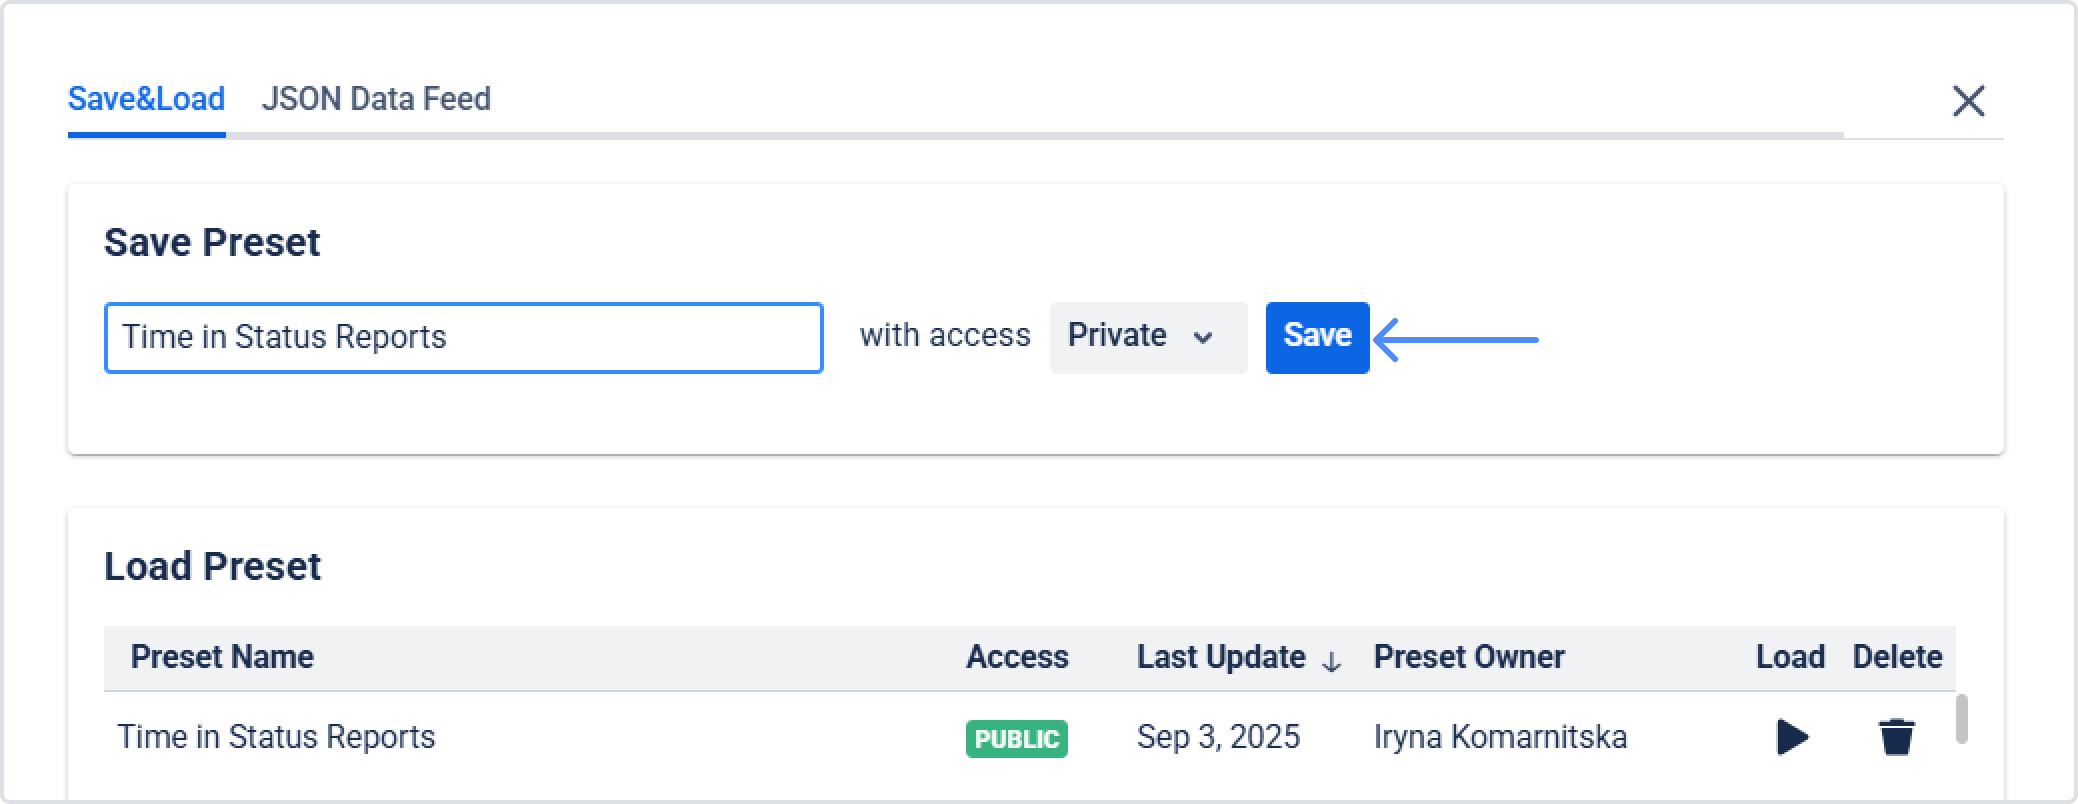
1) Create and save the report preset (Time in Status)
Open Time in Status app.
Configure the report you need (columns, filters, work item and report periods, etc.).
Save as Preset so it’s reusable.
Avoid setting date limits directly in JQL or Filter (e.g., “created in last 30 days”) if you want the sheet to keep rolling forward.
Do use Work Items Period and Report Period in Time in Status to define rolling windows (e.g., Last 30 days, Last month, etc.). This keeps your JSON feed dynamic.
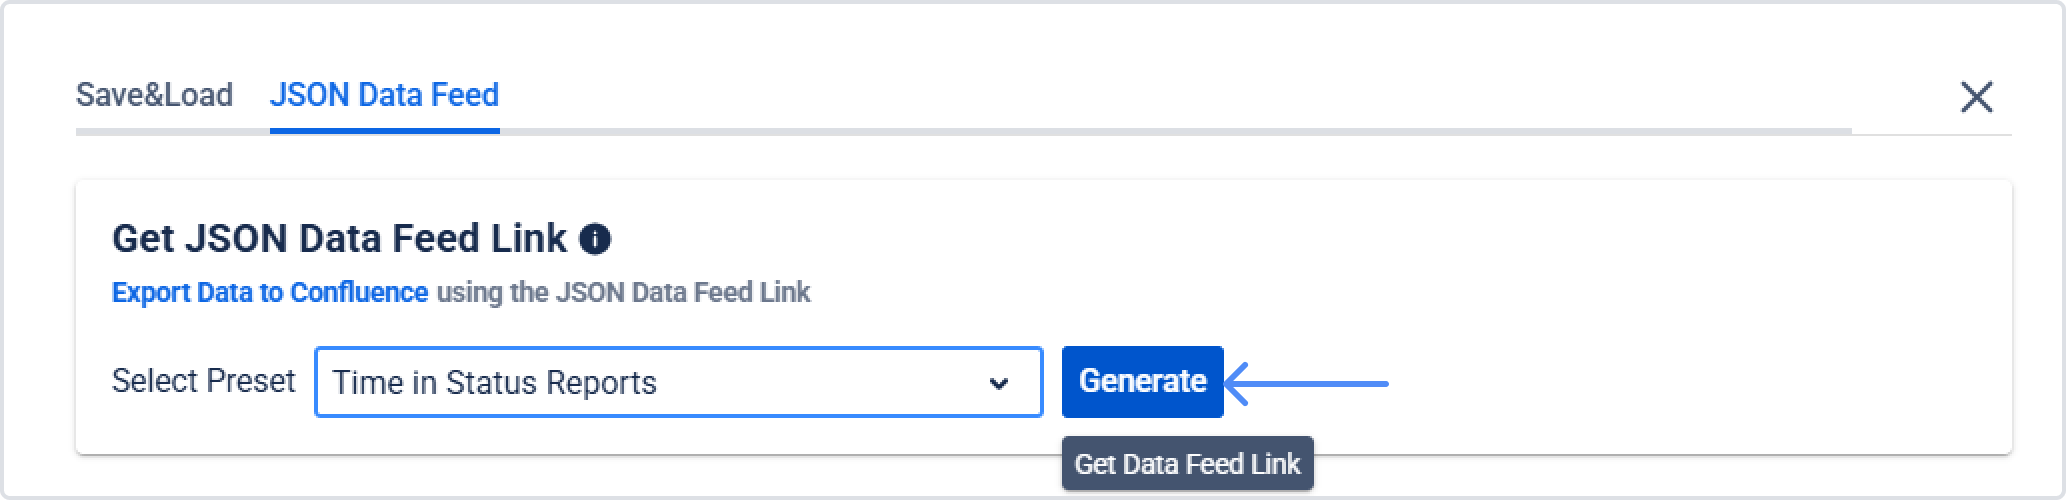
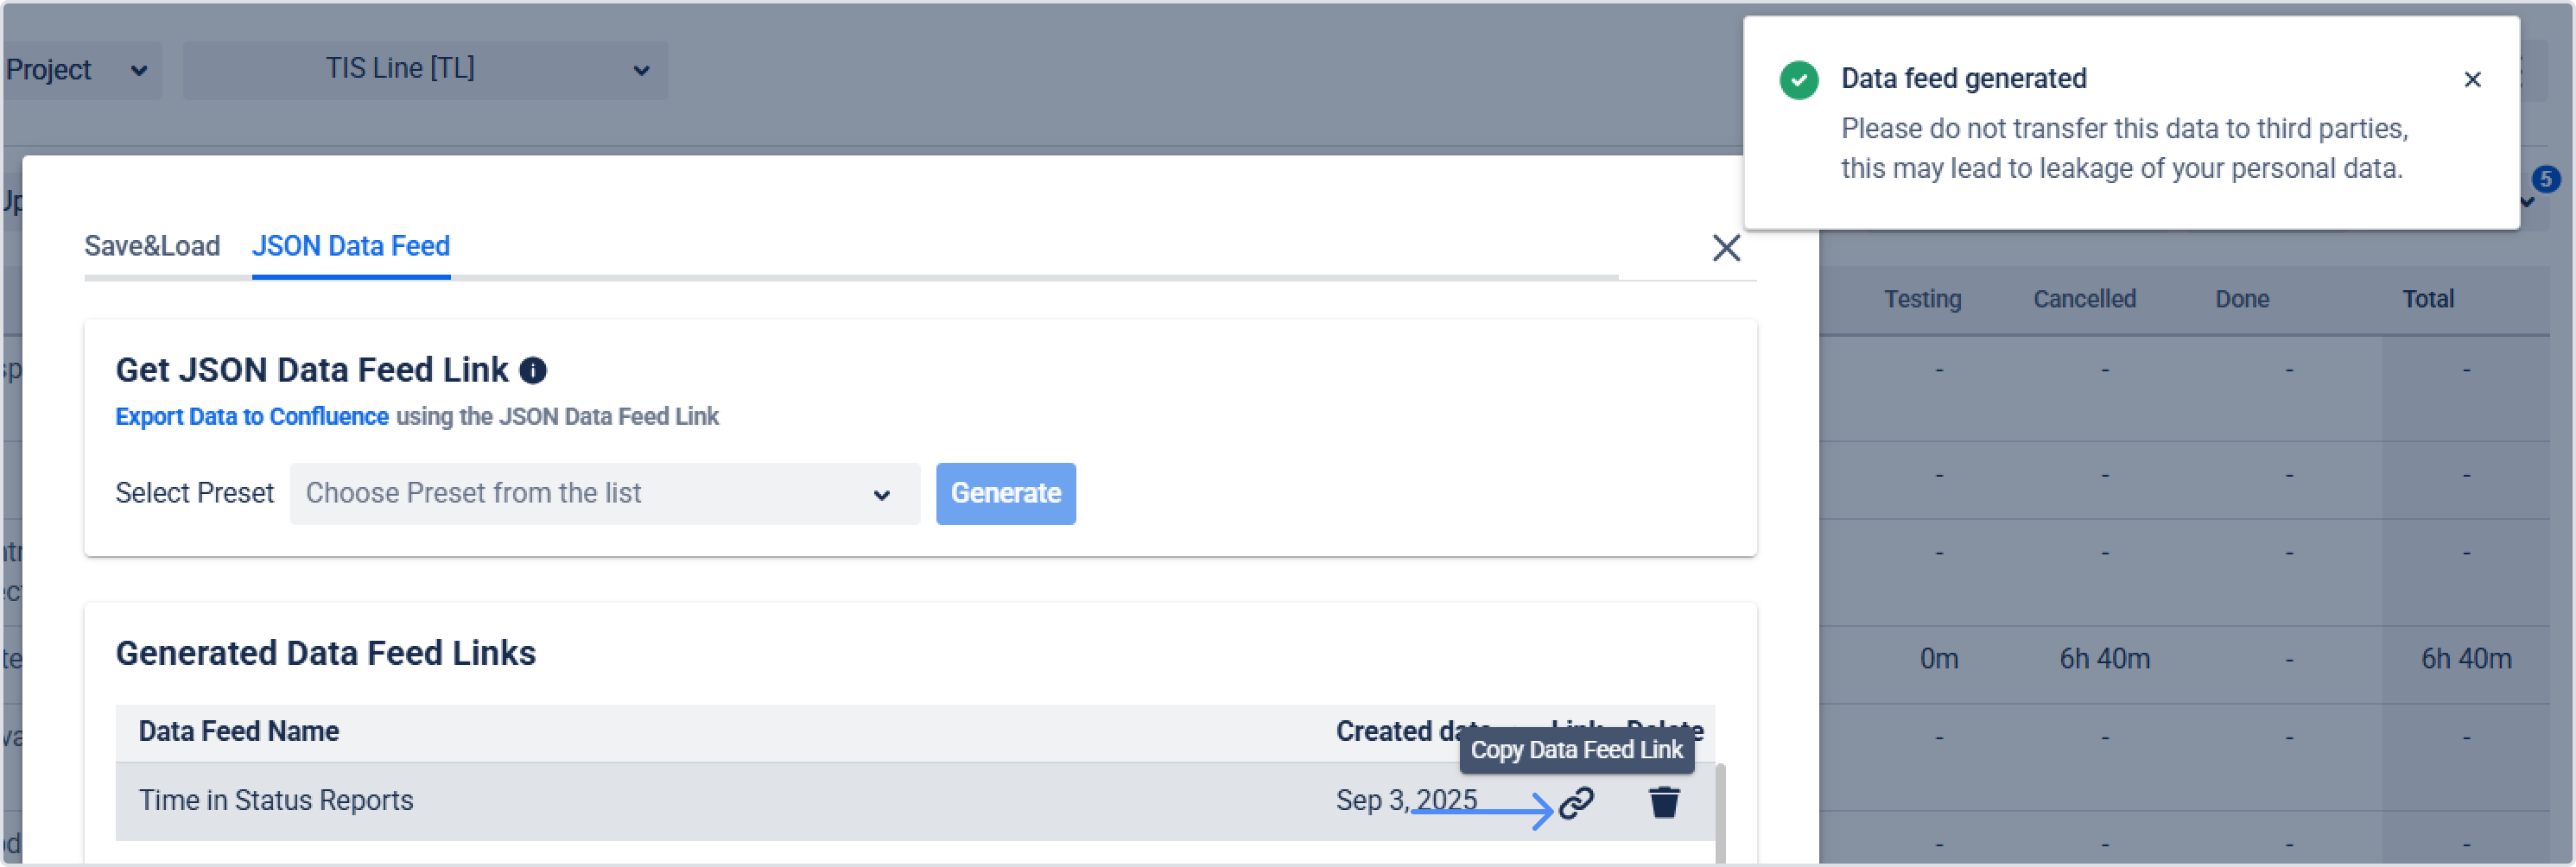
2) Generate the JSON Data Feed
In Time in Status app, open your saved preset.
Choose Create JSON Data Feed for this preset.
Copy the generated JSON feed URL.
3) Bring the data into Google Sheets
Create a new Google Sheet.
Follow the app’s steps to fetch the JSON feed into a sheet.
You should now see a flat table with Issue Key, Issue Type, and status duration fields (in decimal hours).
4) Build the Pivot Table (in Google Sheets)
Select any cell in your imported data range.
Go to Insert → Pivot table → place it on a New sheet.
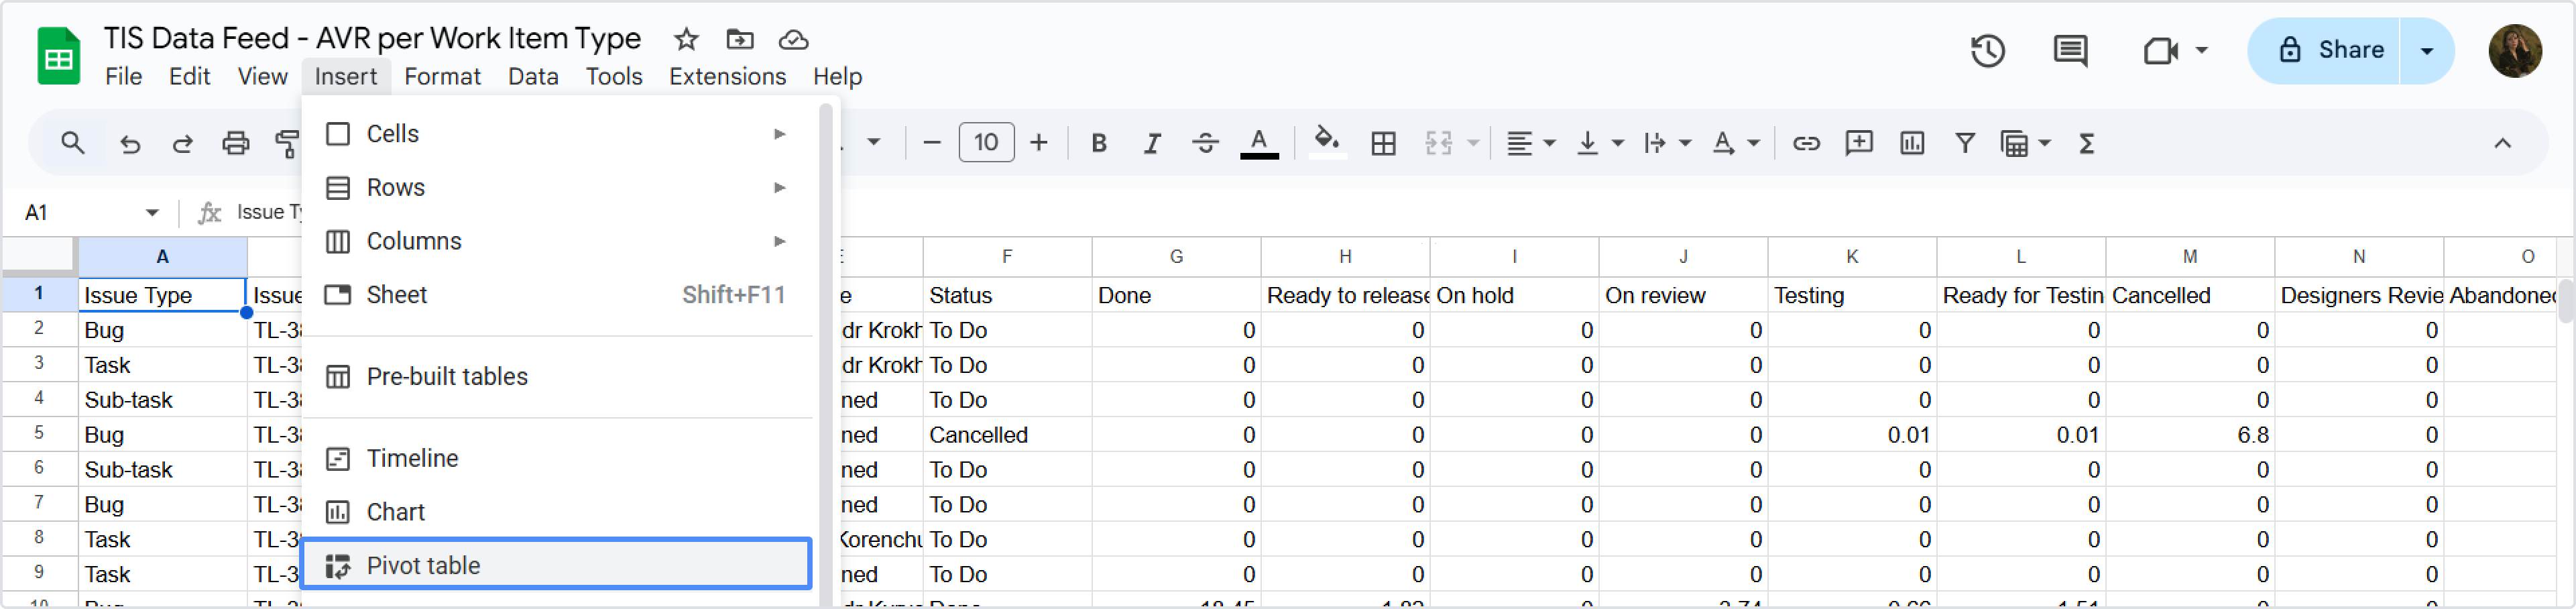
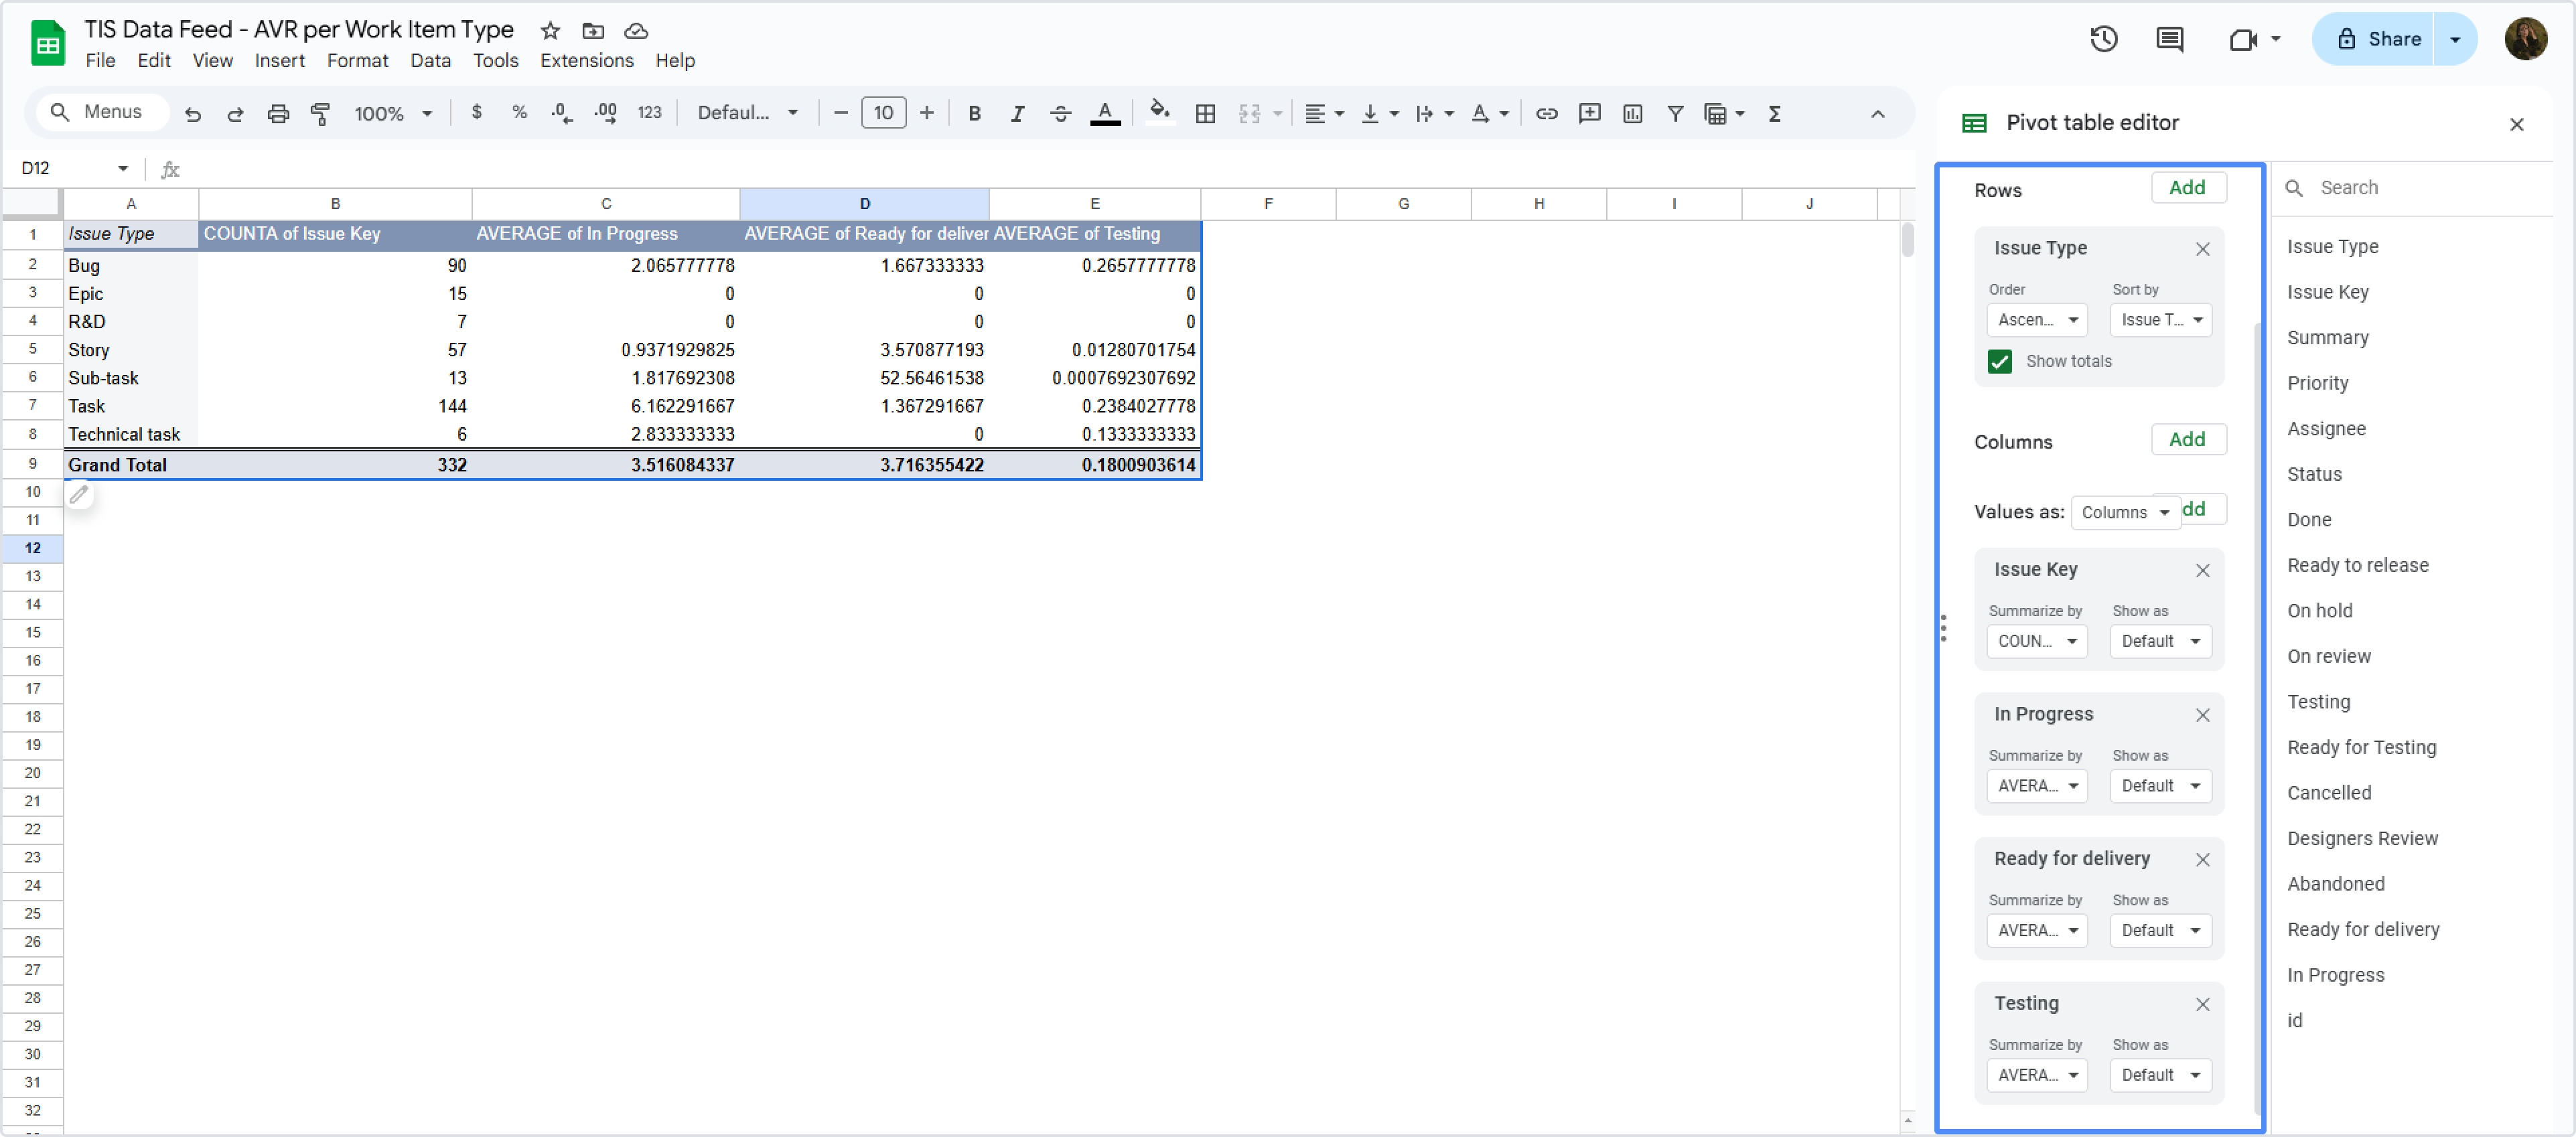
In the Pivot table editor:
Rows → Add → select Issue Type.
Values → Add → select Issue Key → Summarize by: COUNTA (this gives Count of Issue Key).
Values → Add → for each status duration column you care about → Summarize by: AVERAGE.
You’ll now have a pivot showing:
Each Issue Type as rows
A Count of Issue Key
The Average of the selected status durations (in decimal hours)
5) (Optional) Convert hours to working days
Data in Google Spreadsheets is transferred in Decimal Hours format. To calculate data in working days, use the formula:
=(B2/24)/10, where
B2 is the time value you received in pivots
24 is the number of hours in a day
10 is the number of your working hours per day*

* - This number depends on how many working hours are included in your work schedule.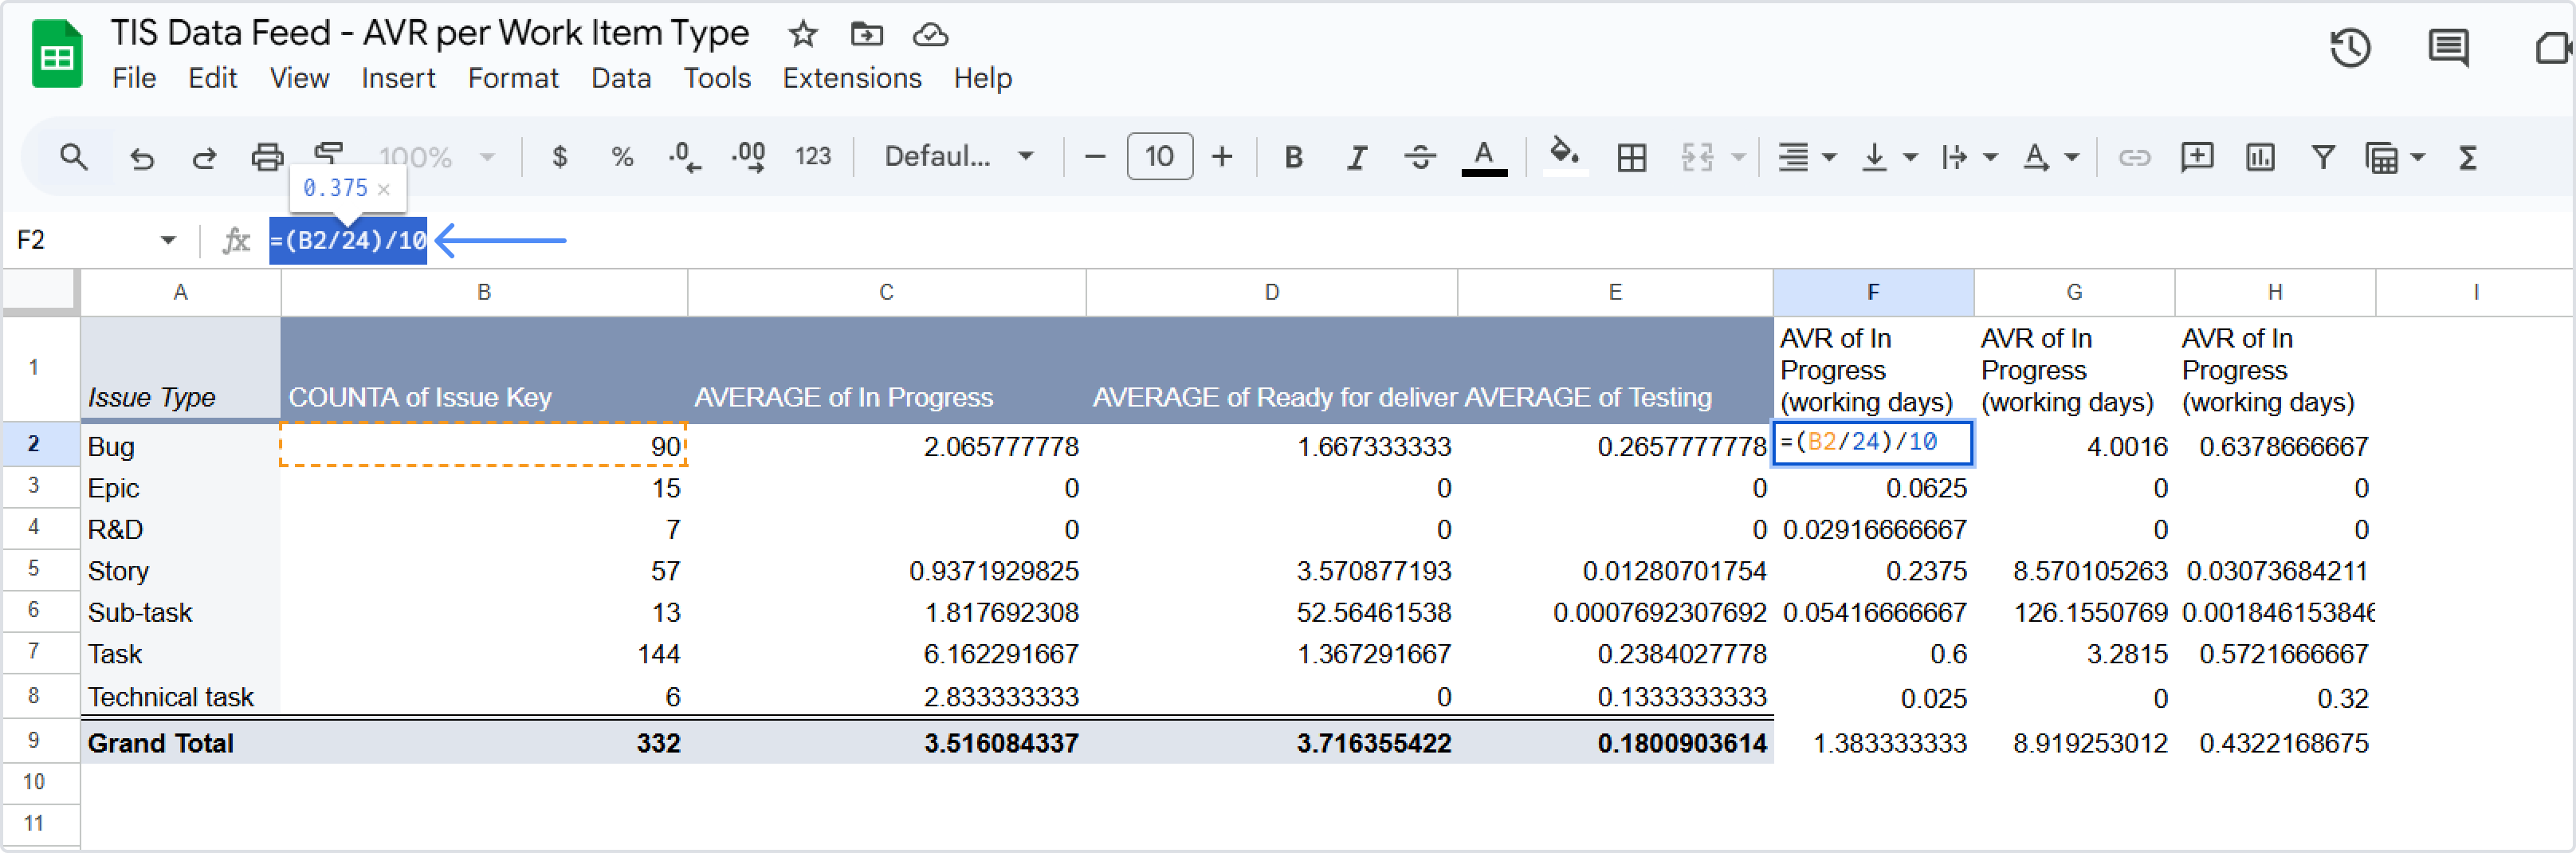
📈 Outcomes: A live Google Sheet connected to your Time in Status preset via JSON Feed.
|
|---|
If you need help or want to ask questions, please contact SaaSJet Support or email us at support@saasjet.atlassian.net
Haven't used this add-on yet? Try it now