Export data from grid and charts | Data Center
How to export data?
You can export the data from the grid as .XLSX or .CSV files, which you can then analyze using tools such as Excel or Google Spreadsheets.
.png?inst-v=1702e073-bb07-4621-bc42-04cb799daf87)
The Export (Advanced) includes access to additional reports, such as Field changes duration and Field changes total count reports.

Field changes duration report automatically calculates the time difference between the selected field changes chosen by the user in the report table.

Field changes total count report automatically calculates the number of changes made to the selected fields in the report table.

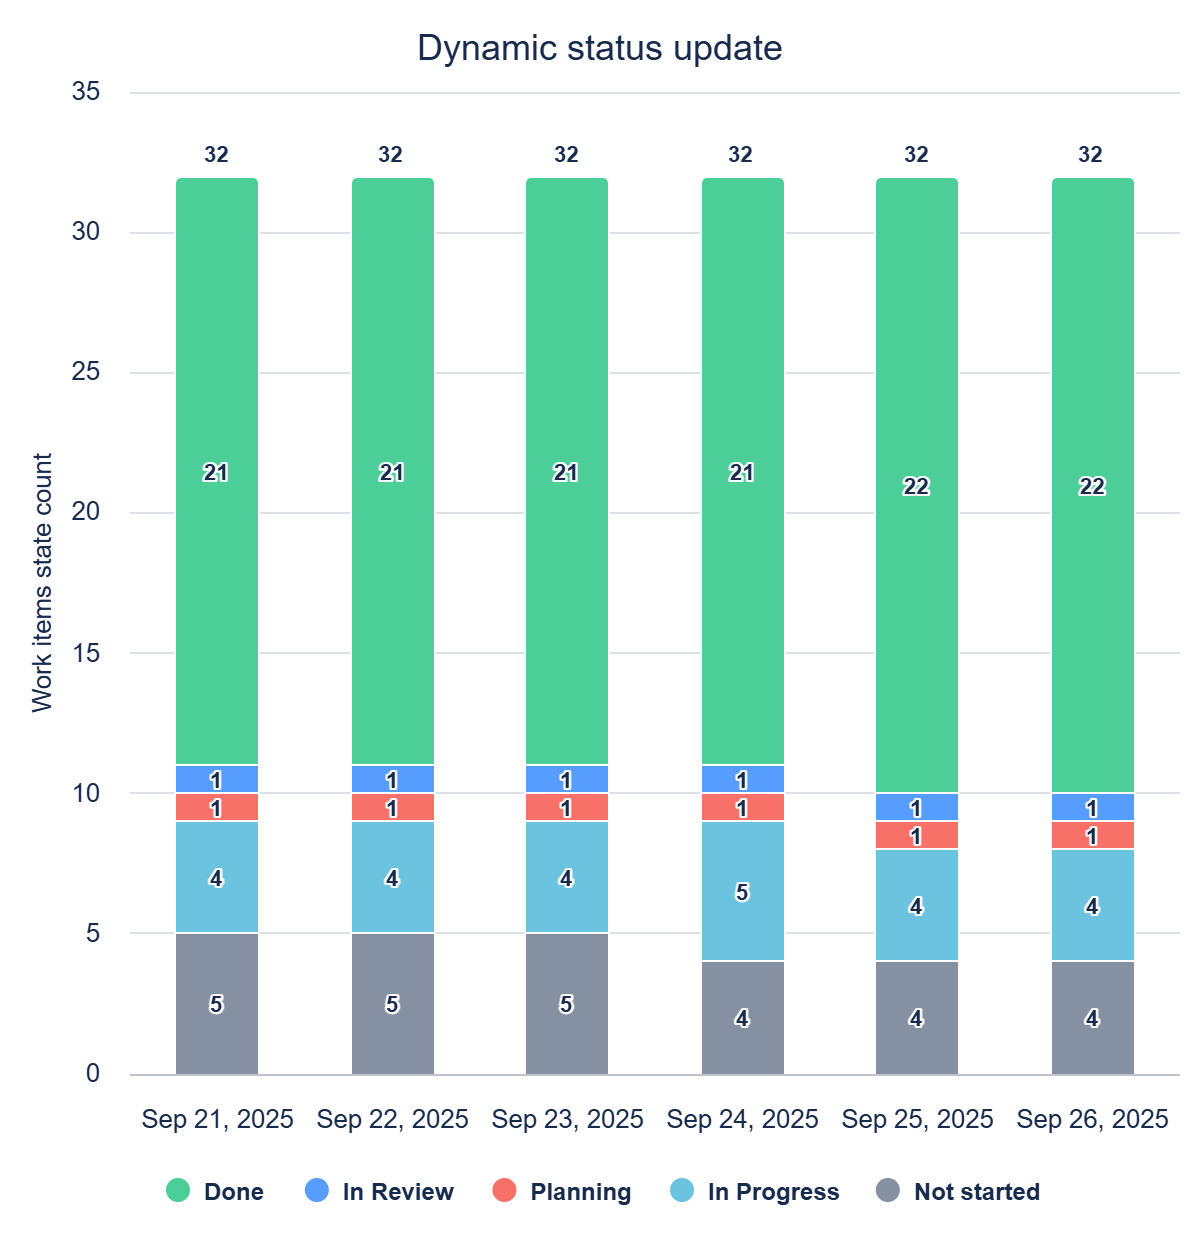
You can export data from graphs to .PNG or .SVG files that you can view with your browser or the Photos application.
.png?inst-v=1702e073-bb07-4621-bc42-04cb799daf87)
What's the difference between file types?
Grid export differences

.XLSX
XLSX is the file extension for a Microsoft Excel Spreadsheet. This file type is also supported by other spreadsheet applications, such as Google Spreadsheets.

.CSV
CSV files are commonly used for data exchange between platforms, making the data “raw” again so it can be processed by different applications. This is the most flexible data format.
Chart export differences

.PNG
PNGs are the most common file type for images and can be opened by any media viewer. The disadvantages of this format are image compression and the inability to scale.

.SVG
SVG is a vector image format and can easily be scaled to any size, will copy text from charts and always display the best picture quality. The disadvantage of this format is that not every program can open this file, often such a picture can be viewed in the browser.
What does export in different formats look like?
XLSX Grid export

CSV Grid export

PNG Chart export

SVG Chart export - https://saasjet.com/svg_export
Haven’t worked with the app yet? 👉Give it a try!